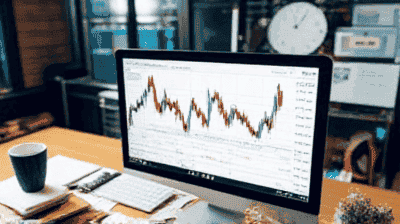
Forex trading, or foreign exchange trading, is the practice of buying and selling currencies in the foreign exchange market to profit from changes in exchange rates. This highly dynamic market offers numerous opportunities for traders, but it also presents its unique challenges. One of the most effective strategies for navigating the complexities of forex trading is technical analysis.
Technical analysis is a method of evaluating and forecasting the future price movements of an asset based on historical price data and trading volumes. Unlike fundamental analysis, which considers economic indicators, news events, and overall market conditions, technical analysis focuses solely on price action.
Price Action Reflection
Identifying Trends
Timing Entry and Exit Points
Risk Management

When using technical analysis in forex trading, several essential tools and indicators can assist in creating a robust trading strategy:
Charts are the foundation of technical analysis. The most commonly used types include:
Line Charts: A simple representation of the price movements over time, showing only closing prices.
Bar Charts: Display opening, closing, high, and low prices for a specific period.
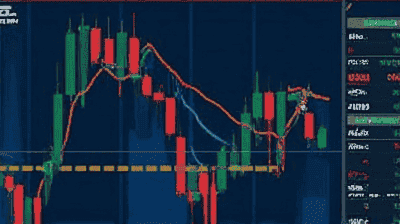
Candlestick Charts: Provide a more comprehensive view of price action by visualizing the same data as bar charts in a more accessible format.
Trend lines are straight lines drawn on charts to connect historical price points. They help identify the direction of the market and can suggest where prices may meet support or resistance levels.
Support levels are price points at which an asset tends to stop falling and may bounce back. Resistance levels, on the other hand, are points where the price often stops rising and may reverse direction. Identifying these levels is crucial for effective trading.
Indicators are mathematical calculations based on price and volume that help traders make decisions. Some popular indicators include:
Moving Averages: Help smooth price data to identify the direction of the trend.
Relative Strength Index (RSI): Measures the speed and change of price movements to identify overbought or oversold conditions.
Moving Average Convergence Divergence (MACD): Indicates buying and selling momentum through the relationship between two moving averages.
Bollinger Bands: Use standard deviations to define high and low volatility levels in conjunction with a moving average.
Chart patterns form as prices move over time and can indicate potential future movements. Common patterns include:
Head and Shoulders: Signifies a reversal in trend.
Double Tops and Bottoms: Indicate potential reversals in bullish or bearish trends.
Triangles: Show continuation patterns where price breaks can signal further movements.
Select a forex trading platform that offers advanced charting tools, a wide range of technical indicators, and user-friendly interfaces. Popular platforms include MetaTrader 4, MetaTrader 5, and TradingView.
Familiarize yourself with different types of charts and how to analyze them. Practice identifying trends, support and resistance levels, and chart patterns. Tools such as trend lines and Fibonacci retracement can aid in visualizing potential price movement ranges.
While no single indicator works best in every situation, combining multiple indicators can corroborate signals. For example, using RSI alongside moving averages can help confirm potential entry points.
Most trading platforms allow you to set up alerts for specific price levels or indicator thresholds. This can help you respond quickly to potential trading opportunities without constantly monitoring the markets.
Craft a comprehensive trading plan that incorporates technical analysis. Include your risk management strategy, trading goals, and rules for entering and exiting trades. Ensure that your plan is flexible enough to adapt to changing market conditions.
Before implementing your technical analysis strategy with real money, conduct backtesting using historical price data. This helps you understand how your strategy would have performed in various market conditions.
Utilize a demo account to practice trading without risking real money. This allows you to apply your technical analysis skills and gain experience in real-market conditions.

Even experienced traders can fall victim to common mistakes when using technical analysis. Here are several pitfalls to avoid:
While indicators can provide valuable insights, relying solely on them without considering other market factors can lead to poor decision-making. Always cross-verify signals with price action and market context.
Technical analysis does not account for fundamental news that can significantly impact currency prices. Stay informed about global economic developments, geopolitical events, and central bank policies that may influence forex trends.
Failing to implement effective risk management can be detrimental to trading success. Always use stop-loss orders and determine position sizes based on your account balance and risk tolerance.
Sticking to your trading plan is essential for success. Emotional trading and deviating from your established strategy can lead to unnecessary losses.
Many traders fall into the trap of overtrading, making too many trades in hopes of quick profits. This can increase transaction costs and lead to mistakes. Focus on quality rather than quantity.
Using technical analysis in forex trading is a powerful approach for understanding market dynamics, identifying potential trading opportunities, and managing risk. By equipping yourself with the right tools, learning various techniques, and developing a disciplined trading plan, you can effectively harness the power of technical analysis to enhance your trading strategies.
It is essential to continuously educate yourself, stay informed about market changes, and refine your trading approach. The forex market is constantly evolving, and so should your strategies and analysis practices. By embracing technical analysis, you can improve your trading effectiveness and work towards achieving your financial goals in the world of forex trading.